WorldWatchers: a free live world map of the news
Over 100 sources bundled into events, with source counts and real measurements. Our new project is online, free, with no account and no tracking.
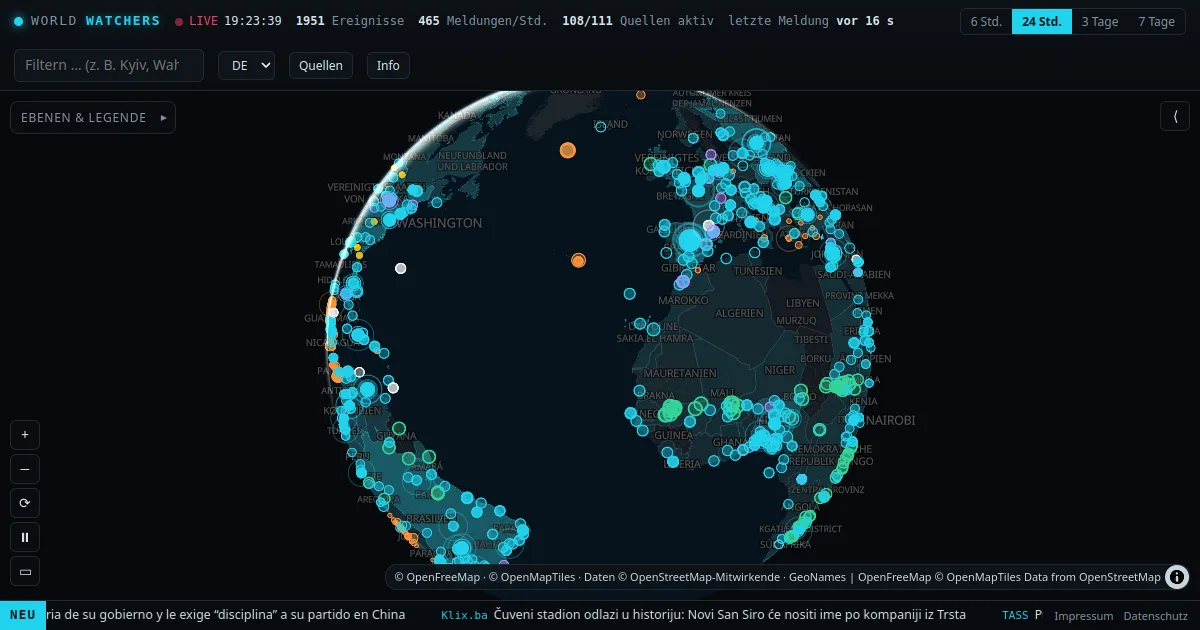
What is happening where in the world right now? News sites usually answer that from a single perspective, and raw data services such as GDELT are hard to use for ordinary readers. That is why our new project has been online since 29 October: WorldWatchers, a free live world map of the news.

What the map shows
- Over 100 news sources from every region of the world and in many languages, polled every 3 minutes.
- Events instead of single reports: reports with similar content at the same place are automatically bundled into one event, even across languages, by comparing shared names and numbers.
- Location with a reason: every event shows which word the location was detected from and how certain the match is.
- Real measurements: earthquakes (USGS, EMSC), disaster alerts (GDACS), natural events and satellite fire spots (NASA), WHO notices and travel warnings from the German Foreign Office.
Source count instead of volume
An agency report carried by five sites looks like five confirmations. It isn't. WorldWatchers therefore only counts independent reports: identical wording counts once. A big circle on the map really means that many newsrooms are reporting on their own. State media are labelled.
Sensor cross-check: when news and measurements match
This does not exist in this form anywhere else yet: WorldWatchers automatically compares reports with measurements. When media report an earthquake, a cyclone, a flood or a fire, the map checks whether sensor networks and satellites actually registered something at the same place and time. If both match, the event gets a yellow core and the note “Measurements match”, with a link to the measurement.
Two examples from launch day: reports on cyclone “Arnab” in India appeared next to a red GDACS alert. Reports of an earthquake in Mexico appeared next to an actually measured magnitude 4.3 quake.
The limit matters to us: this is an indication, not proof. A heat spot in a satellite image can also be a field fire, and the map says so.
Weather and severe weather
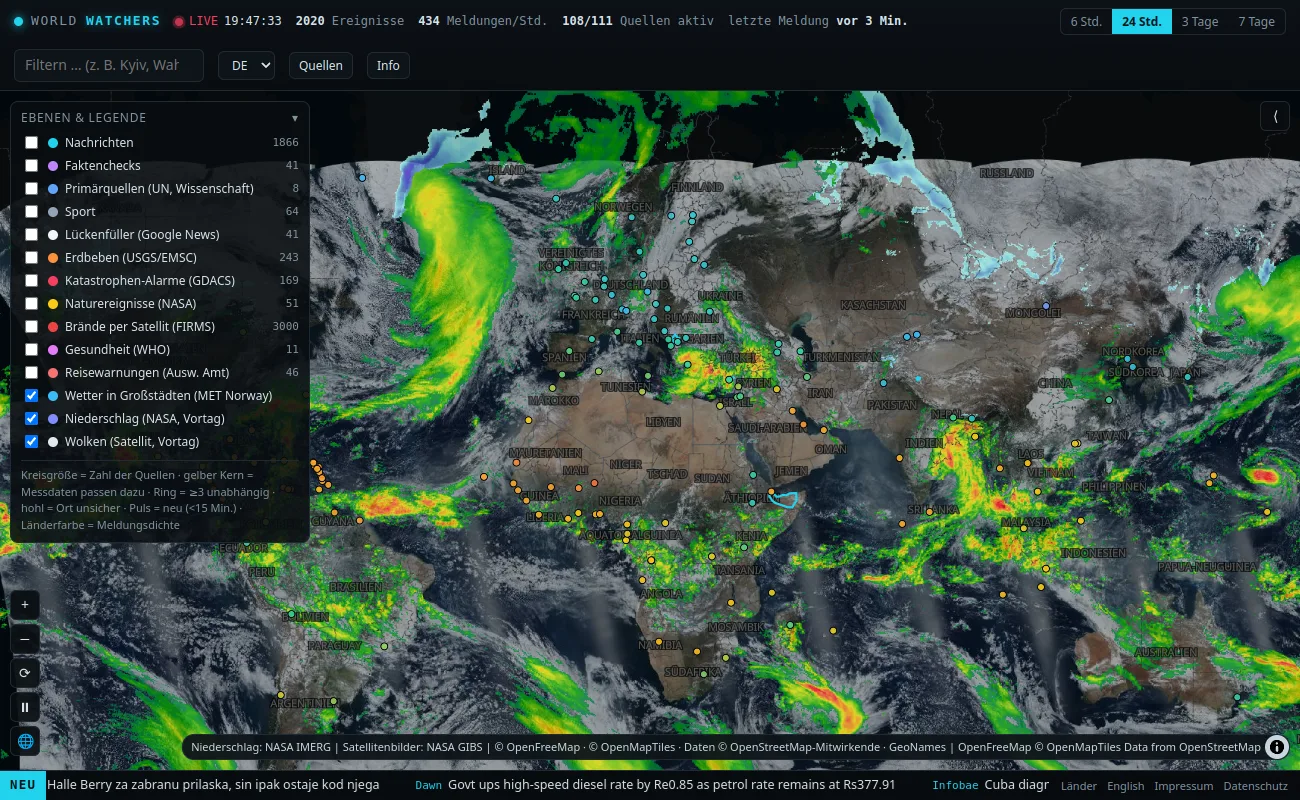
On request the map shows the weather in around 150 major cities (data from the Norwegian Meteorological Institute), NASA cloud and precipitation imagery, and the official severe weather warnings of the weather services in Europe (via Meteoalarm) and the US. Only orange and red warning levels are shown.
A page for every country
At worldwatchers.agency/en/countries every country has its own page: “What's happening in …?” with the events of the last 72 hours, sources, measurements and travel warnings.
What the map is not
WorldWatchers does not decide whether a report is true. The map shows who reports what, how many report independently and whether measurements match. Locations and bundling are automatic and can be wrong, so every event shows how it came about.
No account, no tracking
No account, no ads, no cookies. Even the map imagery is loaded from our server, not from third parties. We only count visits anonymously as daily totals, without being able to recognise you.
Get involved
Missing a source from your region? In the “Sources” window on the map you can suggest it and explain why it should appear on WorldWatchers. We review every suggestion.
What's next: a time slider to replay the situation of the last days, and later assessments with a publicly visible track record.
ABYNTIS is an AI colleague for small businesses — chat, phone, files, calendar and your PC in one system, hosted in the EU.
Live demo →